Advantive

Power BI Reporting of SFV MES and Factboard Data

By Will Bosley Updated
View post titled Power BI Reporting of SFV MES and Factboard Data

Proplanner’s new Power BI connector for Shop Floor MES (SFV) and Factboard allow you to combine, summarize and report on the vast amount of data collected by those systems.  This data can then be aggregated, filtered, analyzed, formatted, charted and displayed per your needs and even shared among other users in your company.

Shop Floor MES collects data about every Activity performed by every user on every unit.  Additionally, engineers can choose to ask the user to scan or enter additional data as they perform Worksteps inside those Activities.  Since all Industrial Internet of Things (IIOT) interfaces, such as DC Torque Tools, Pick-2-Light Systems, or PLC’s are connected to SFV Worksteps, this means that all collected data from those systems is available as well.

Factboard receives Posted transactions from SFV and any other factory systems capable of sending JSON Posted messages.  Often these transactions involve key shop floor events such as products arriving and departing stations, Assembly line stoppages, or Quality and Logistics issues.  These transactions, including all of their attribute data are available to Proplanner’s PowerBI connector.

To take advantage of this powerful new capability, find the Proplanner connector, (included free to all subscribers) and connect to your dataset, then sign into your Proplanner account and the connection will be established.   When you open your Power BI session this connection will provide access to all the SFV MES and Factboard data tables.

In the Proplanner data model, each assembly line is in its own folder, and contains, Signoff, Issue and Build List data.  Additionally, any IIOT data can be found in the Custom Tables associated with each device interface (i.e. Workstep IOT table).  Once selected, you will be able to choose how many months of data to pull from each data set. 

When you apply that imported data in PowerBI, you can preview it in a spreadsheet table format.  You will then want to use the PowerBI features to transform it and filter out unwanted data that you don’t plan to use in your visualization.  In the example below, we are only looking for data from the torque tools in the selected workstations.

Once you apply, all the data will be loaded into PowerBI and the table will show up with all fields defined with appropriate data types.

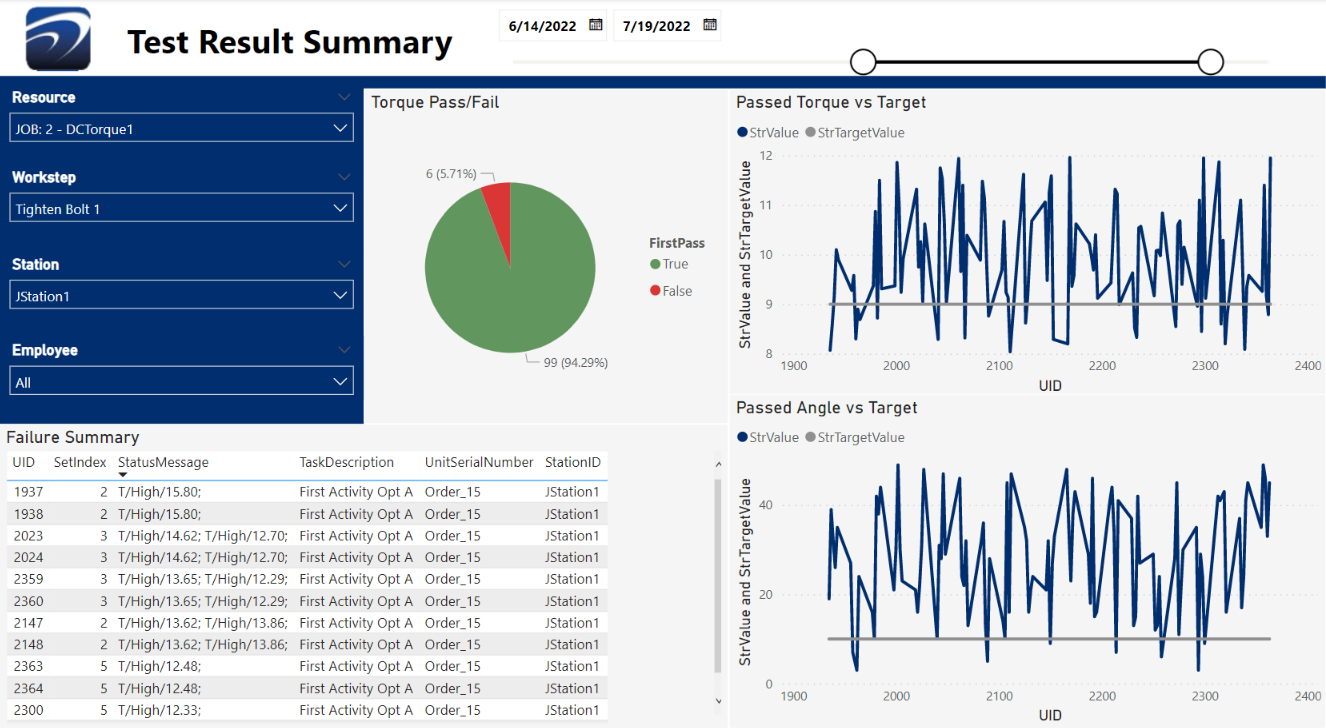
At this point, you can select your desired values for charts or tables.  Sometimes, you will get more attribute values than desired (i.e. torque and angle), you can filter what you need (i.e. torque) and sort even further using Slicers.  For example, you can select specific resources and/or date ranges. 

With PowerBI, you can even share these custom reports via the web and publish to other people within your organization.

Check out this video for even more information on how to use this powerful new capability!

Will Bosley

About the Author Latest Posts

Editorial standards

Fact-checking & editorial guidelines

Every article on advantive.com is written and reviewed against an internal accuracy standard before publication. Here's what that means in practice.

  • Product claims are verified by the brand team that owns the platform.

    When an article references InfinityQS, WinSPC, PQ Systems, Pinpoint, ParityFactory, ProPlanner, KiwiPlan, DDI System, VeraCore, or any of Advantive's other specialty platforms, the relevant product team checks technical statements about features, deployment, and current capability before the article goes live.

  • External statistics cite their source inline.

    When an article references industry survey results, regulatory benchmarks, or third-party research, the source is linked at the point of citation. Statements without an inline source link are first-party observations drawn from Advantive's product teams or customer base.

  • Publication and revision dates stay visible.

    The original publication date and the most recent revision date are both shown on every article. Topics that change quickly — AI capabilities, regulatory rules, product roadmaps — are revisited on a tighter cadence than evergreen reference content.

  • Corrections are issued openly.

    If a factual error is reported, the article is updated, the revision date advances, and material corrections are noted at the bottom of the article so readers can see what changed and when.

Found something wrong, or have a citation to add? Get in touch with the editorial team and we'll review it.

Subject-matter review

Reviewed by subject-matter experts

Advantive is a portfolio of 14+ specialty software platforms — each one built and maintained by a product team that has spent years inside a specific manufacturing or distribution discipline. Articles in technical channels are reviewed by the relevant team before publication.

  • Quality & SPC content

    Reviewed by the InfinityQS, WinSPC, and PQ Systems product teams — the platforms behind statistical process control, capability analysis, and gage management deployments across food, automotive, pharma, and CPG manufacturers.

  • Manufacturing operations & MES content

    Reviewed by the PINpoint, ProPlanner, ParityFactory, and VIA Information Tools teams, whose platforms run production scheduling, traceability, and shop-floor execution for discrete, automotive, and food-and-beverage manufacturers.

  • Packaging & converter content

    Reviewed by the KiwiPlan, Abaca, and AdvantZware teams, who build software specifically for corrugated, folding-carton, and packaging-converter operations.

  • Distribution, ERP & B2B commerce content

    Reviewed by the DDI System (inFORM ERP), Distribution One, VeraCore, Pepperi, and Commerce Vision teams, whose platforms run wholesale ERP, fulfillment, field sales, and B2B portals for specialty distributors and 3PLs.

Are you a practitioner with domain expertise to contribute? Get in touch — we accept guest contributions from operators in the industries we serve.