Blog — Page 27
More posts from the Advantive team. 323 posts total.
-
Jul 22, 2013 · Grace Barton
Why Statistical Process Control is Necessary for Your Organization
Imagine this scenario: a patient undergoes hip surgery, only to be told that the replacement product that was installed inside of his or her body must be recalled due to a defective feature. Months, or perhaps years, of grueling rehab are compromised due of a lack of statistical data that could have prevented such instances … Continued
-
Jul 16, 2013 · Grace Barton
What is Manufacturing Quality Control?
Think of the amount of work required to transform a car from a random collection of assorted parts into the assembled entity that it is when it reaches the end of a production line. Cars don’t just spontaneously appear. There are a multitude of pieces that have to be put together in order to create … Continued
-

May 20, 2013 · Grace Barton
The Top 3 Benefits of Statistical Process Control Software for Quality Control
The next time you are walking through a store, take a moment to stop and look around. It can be any store, really, as long as there are products that line the shelves or showroom. Think about the level of care that went into inspecting each product that is for sale. Companies ensure the quality … Continued
-
Feb 20, 2012 · Grace Barton
Organizing Charts in Engineering Mode: The Matrix Style
You have four charts and only one computer screen. How do you consolidate to a multiple chart view to compare data without having to thumb through individual charts? You might be tempted to resort to flashy, “Matrix”-style moves, but fear not, there is a simpler approach that is just as effective and doesn’t require stretching. … Continued
-
Aug 1, 2011 · Grace Barton
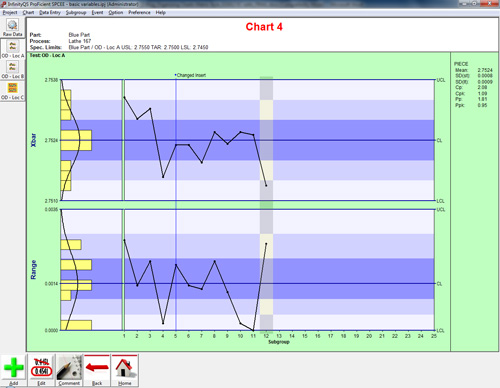
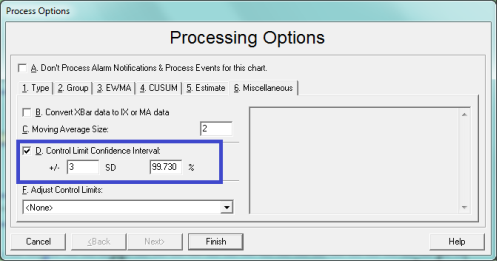
Modifying Control Chart Sensitivity
Control limits are typically set at +/- 3 standard deviations for the statistic being plotted. That‘s how traditional Shewhart control charts have been constructed for nearly a century. The result is a statistical tool that is simple and elegant, yet robust enough to tackle all manner of different situations and distributions of data. Control limits and their widths … Continued
-

Aug 4, 2010 · Grace Barton
Gage R&R study questions answered
We frequently entertain questions about MSA and specifically, gage R&R. Below are two questions we recently received: Question #1: “What are the requirements for the parts chosen in a study? Do the parts have to have the same specification?” Answer: The parts selected should be representative of the process variation that is producing them. This implies that … Continued
-

Dec 3, 2009 · Grace Barton
The difference between run charts and control charts
A customer recently asked one of our support representatives the following questions: What is the difference between a run chart and a control chart? And when should I use one vs. the other? These are great questions because they allow us to highlight some of the benefits of control charts. When you create any chart, … Continued
-

Feb 3, 2009 · Grace Barton
Stats tip: Within and between subgroup variation clarified
I received a question after my last blog post asking me to clarify the concept of within and between subgroup variation which is used in calculating Cpk, Cp, Cr, Ppk, Pp, Pr and other statistics. Here is an example I used to help explain the differences. Let’s say that every day I run about 30 … Continued
-
Jan 29, 2009 · Grace Barton
Stats tip: Help! My Ppk is larger than my Cpk
I often get asked SPC application questions such as: Can Ppk be larger than Cpk? Can Cpk be larger than Cp? Do you recommend CPM, Cpk, Ppk or something else? I prefer to answer these process capability questions with simple one-word answers, but that doesn’t usually satisfy the quality zealot’s curiosity. So here’s the long … Continued
-

Feb 26, 2008 · Grace Barton
3 “Nevers” of Control Limits, Part 2
Never allow control limits to be automatically recalculated I was hiking in the Smoky Mountains National Park with a colleague, and we happened upon fellow hikers. Being the friendly sorts that we are, we stopped to take a breather and chat with our new female friends. We enjoyed resting and speaking with the women until … Continued
-
Feb 24, 2006 · Grace Barton
Techniques for the Evaluation, Reduction, and Elimination of Excess Material Flow within Industrial Facilities
The flow of material represents 2, and practically even 3, of the 7 wastes as defined by LEAN practitioners. As such, the methods for evaluating, reducing, and eliminating excess material handling are fundamental to any LEAN improvement initiative. The 7 wastes defined by LEAN practitioners include the following: Material handling involves the Movement (relocation) of … Continued