3PL Customer Profitability & Business Intelligence
Business isn’t easy for a 3PL provider. Competition is high, profit margin is low and managing distribution, warehousing and fulfillment can be chaotic. 3PL’s must be smart about the type of customers they take on and how they run their overall operation since a 3PL’s customer base determines their profitability. In order to maintain a competitive edge and scale their business, 3PL providers must learn to make the most of limited resources, space, and labor.
Profitability Monitoring
In order to ensure the use of space and labor is optimized, 3PLs should monitor the profitability of each customer on an on-going basis. Profitability monitoring can include analyzing different aspects of a customer’s profile like revenue, costs and margins. For example, you may have noticed stagnant inventory that is taking up space or high receiving costs for a customer due to a bad packaging job by the manufacturer.
How many companies do this today?
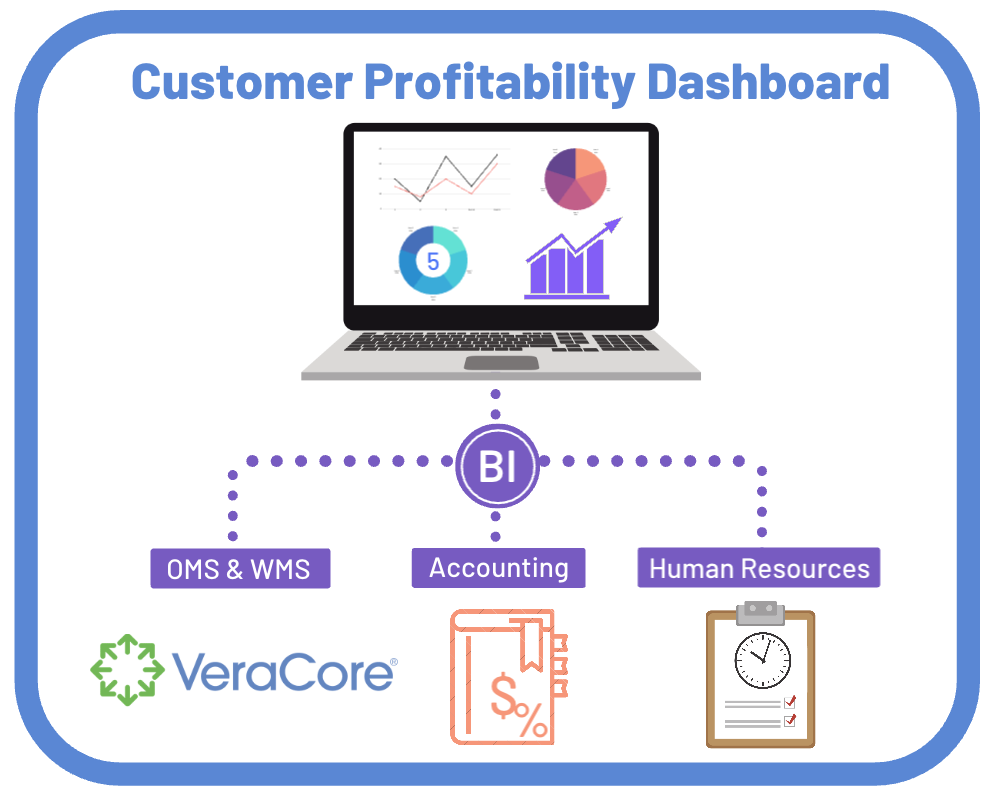
Without the right tools, monitoring profitability can be a challenge. Many 3PLs choose best-in-class tools for each area of their business like OMS/WMS software for Operations, Accounting software for Finance and HRIS software for HR that tracks labor and hours. While this may sound like a good process, the data needed to monitor profitability lives in siloed applications and can be difficult to view, analyze, and make decisions on. Without some additional tooling, analyzing customer profitability can be a time-consuming manual process, it might look something like this:
- Export detailed data from all 3 systems outlined below
- Convert data to a useful format by aggregating and joining data in a tool like Excel with complex functions like VLOOKUP and Pivot Tables
- Review aggregate data and determine profitability/margins
In today’s dynamic and fast-paced world of e-commerce and fulfillment, many business owners who wear many hats do not have enough time or resources to perform this type of manual analysis on an on-going basis every month.
What if there was a better way?
Enter Business Intelligence Tools, often referred to as “BI” tools. BI tools are a class of tools to help automate the process so you can quickly and accurately see the profitability of each customer on a daily, weekly, monthly, quarterly basis. There are many tools out there that help import, join, aggregate, and visualize data from multiple systems, top players include Microsoft PowerBI, Tableau, and Qlik.
If a 3PL has selected good software for Operations, Finance and HR, using a BI tool to analyze customer profitability is relatively straight forward. These tools can be connected in just a few simple steps (8 to be exact!)
- Connect BI tool to key software applications
- Capture key data
- Aggregate Revenue data from the OMS/WMS billing module
- Aggregate in-direct cost data from Accounting system
- Aggregate direct labor hours/cost from HR system
- Calculate profit or loss for each customer
- Report on profitability across all customers in a centralized dashboard
- Create visualizations that make this data easy to consume and understand
Analyze data and use it to optimize your business
Based on the data you see in your dashboard, start to identify your best customers (i.e. most profitable) and make sure you understand why they are profitable. Ask yourself how can you replicate this profitability for other customers.
Now look at the other side of the spectrum, review your less profitable customers. Dig into why they are unsuccessful. Ask questions until you’ve uncovered issues you can take action on.
- Do you need to make changes to operations to reduce costs for this customer?
- Do you need to better track labor costs to see why you are spending so much time on an unprofitable customer?
- Should you increase your rates for unprofitable customers?
- Should you end your relationship with unprofitable customers?
While creating a customer profitability monitoring tool might sound time-consuming and have some upfront overhead, the ROI should pay itself back in no time. When business data connects to a BI tool, 3PLs gain a clear understanding of each of their customers. This impactful data and insight can help guide 3PLs to take the right steps to be more successful.
Grace Barton
Marketing Specialist
About the Author Latest Posts
Grace Barton is a digital marketing and competitive intelligence professional who crafts strategic narratives by bridging marketing insights with analytical expertise. At Advantive, she creates engaging, data-driven content tailored to the distribution, manufacturing, packaging, and quality industries. Her goal is to deliver impactful messaging that drives engagement and growth based on specific gap closure needs, whether responding to sales organization requirements, pinpointing gaps in content, or meeting immediate market trends.
She thrives on transforming competitive intelligence into actionable insights for the sales organization. Grace manages Advantive’s competitive intelligence platform, Klue, to equip the sales team with the battlecards and market data they need to stay ahead of competitors. Since launch, she’s built 28+ battlecards across four lines of business, ensuring the GTM strategy stays sharp.
Grace has a passion for leveraging market insights with storytelling to guide strategic decision-making, empower sales organizations, and nurture organizational growth.
Areas of Expertise: Digital Marketing, Competitive Intelligence, Strategic Narratives, Marketing Insights, Analytical Expertise
- Why Scheduling is Still the Hidden Lever in Corrugated Packaging May 14, 2026
- From Data to Decisions: What AI Could Unlock Inside Your ERP April 30, 2026
- From Data to Direction: Why Advantive ONE Signals a New Era of Industrial AI April 14, 2026
- When the Warehouse Becomes the Bottleneck April 9, 2026
- The Power of Virtual Assistants When They’re Built for Real Work February 3, 2026
Reviewed by
Distribution & 3PL review panel
Articles on wholesale ERP, 3PL operations, and warehouse management are reviewed by the DDI System (inFORM ERP), Distribution One (ERP-ONE+), and VeraCore teams — the platforms running specialty wholesale and fulfillment operations across HVAC, plumbing, electrical, fasteners, JanSan, and 3PL verticals.